There are many ways to present an idea, plan, and report. Whether you use only long texts or some visualization, the goal is clear – to show what you want in the best possible way.
However, using only text for your reports to present your ideas or theoretical solutions is not the best option. We recommend that you always include some visualization methods in your reports. Whether you use presentations, videos or charts, you are sure that these actions will enrich your work.
Visualization will undoubtedly have more significant effects on readers or participants than the text itself. Choose to include charts or similar visualizations. It will be more interesting, but readers will be able to understand the situation you are displaying through the chart much faster than reading the text.
Also, it eliminates the possibility that some readers may miss essential parts of the report or go unnoticed.
As interesting as your topic may be, it will surely be even more engaging if you equip it with exciting content. Attracting the reader’s attention and intriguing them to stay on the page is sometimes only possible by creating visual solutions.
How the charts will look depends on whether they will be colorful and numerous or decent and carefully selected. You are left with a choice, but they must be a part of your reports.
To help you create them, stay with us and look at our selection of the best chart-making tools. According to your ideas and needs, choose one of the listed tools and earn praise for a job well done.
So let’s begin with our list!
Visme
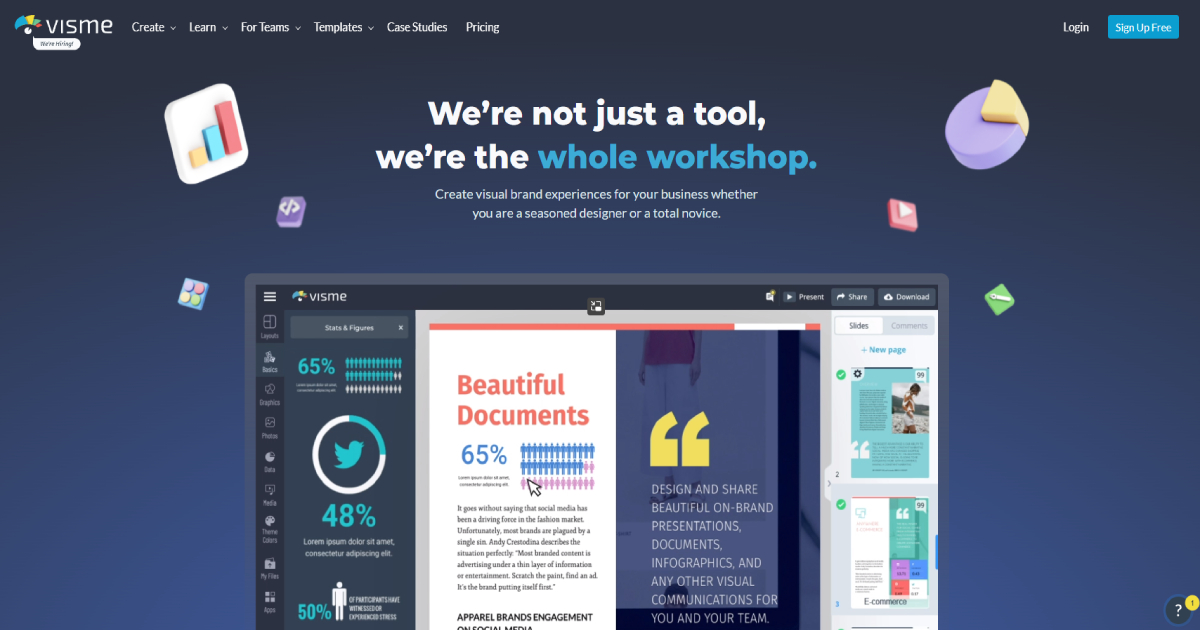
If you’ve ever looked for charting tools, we’re sure you’ve heard of Visme. If you haven’t yet, let us introduce you to this exceptional tool and its great features. Not only does it give you the ability to create colorful charts, but also presentations, charts, infographics, documents, graphics, prints, and many other options.
Create visually appealing content for your readers and target audience and expand the word you want in the right way. With many users around the world, Visme will not disappoint you.
Some of its features that delight us are that this tool offers 1000+ pre-designed templates that are easy to use, millions of images, 1000+ icons, 50+ charts, folders, and widgets for data and the like.
In addition, by using Visme, you will be able to embed audio, video, or any other content. One of the tempting facts is that you will have the ability to share content in any format, whether online sharing, private or content download.
It is no wonder that Visme is gaining more and more users every day.
Lucidchart
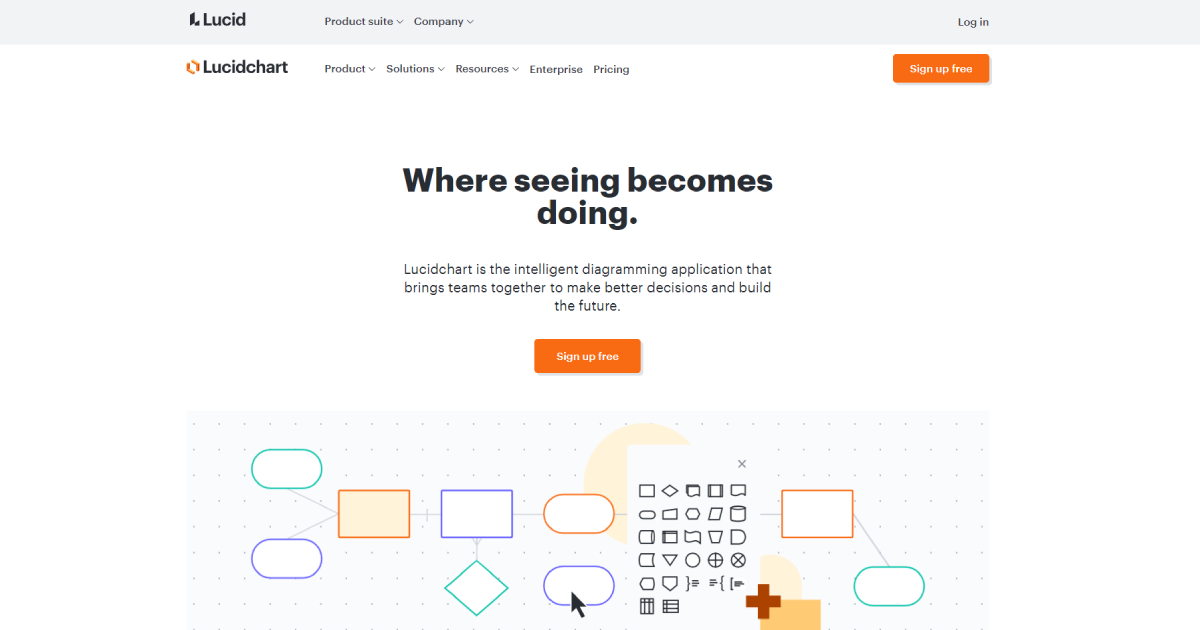
For your business venture and meaningful presentations, choosing Lucidchart will leave all participants in awe. With over 500 templates, this tool will allow you to create data diagrams by importing data or using an automated layout.
It is ideal for real-time work, and all participants can efficiently work and create extraordinary things. In addition, you will get security, but also integration with all the main leading platforms. It is worth trying and deciding if this tool is the right choice for you.
Infogram
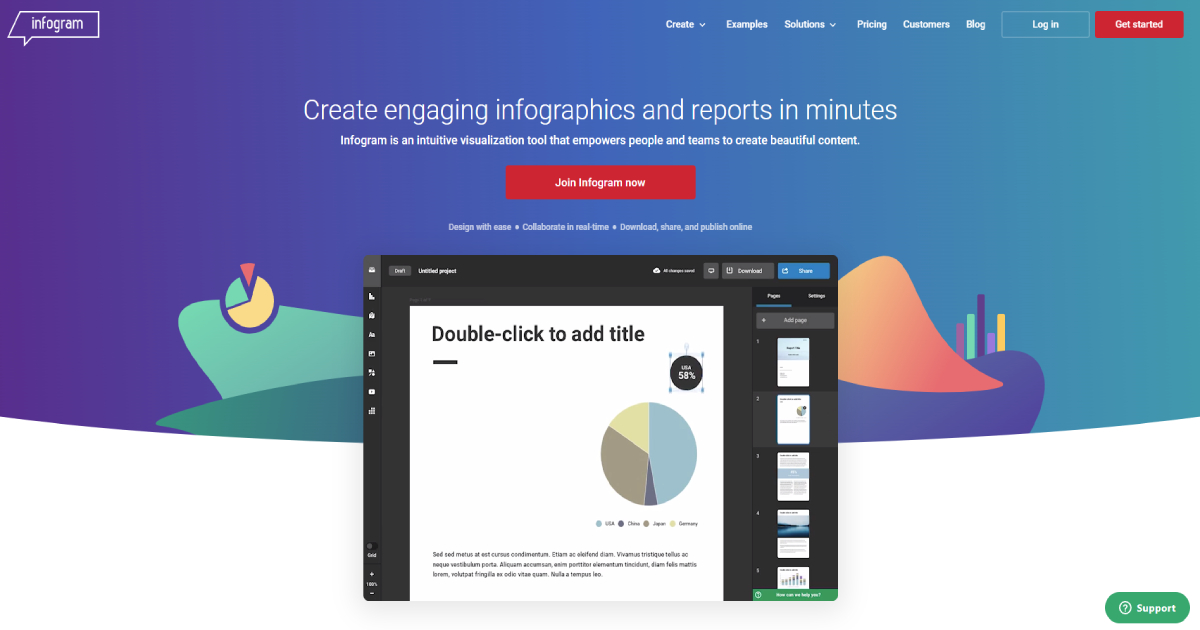
If you don’t want to create your designs, don’t worry, Infogram has solutions for you. It offers you ready-to-use many templates and designs that you can use.
Like Lucidchart, it is ideal for creating in real-time. A feature that delights users is the ability to monitor and work with analytics functions, evaluate interactivity and make custom connections.
By choosing Infogram, you will be able to create innovative dashboards, slides, reports, maps, social media graphics, and more.
Creately
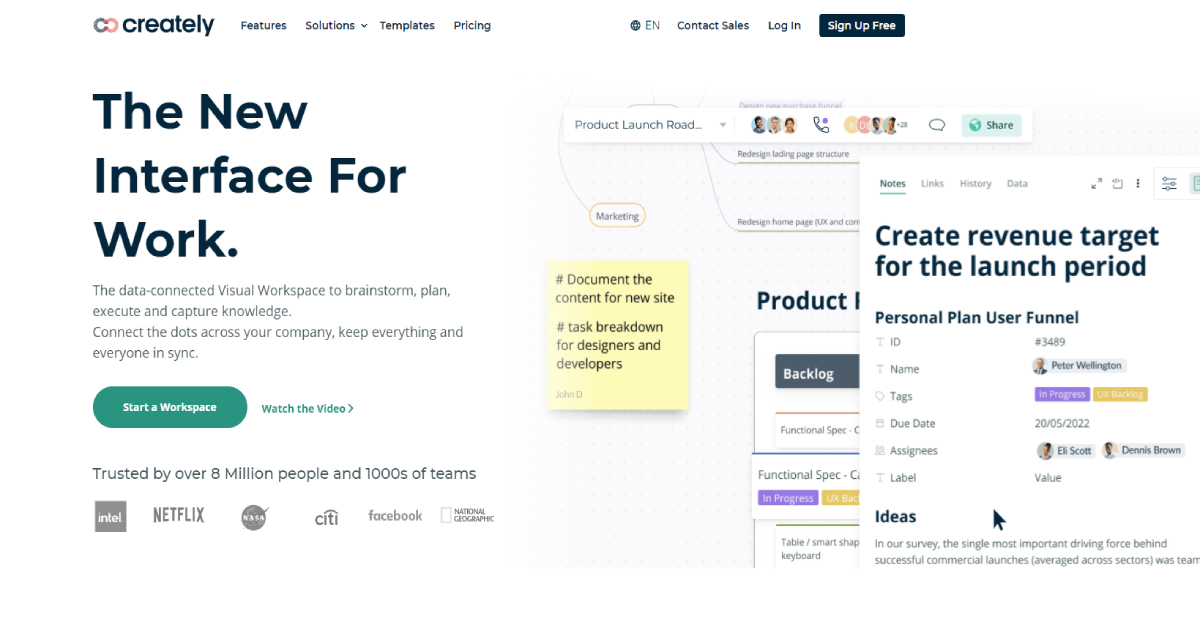
The name is really in line with this tool. Creately is an ideal tool for creating your ideas and creations that you will proudly present at reports and business meetings. By choosing this tool, you stand shoulder to shoulder with over 4 million satisfied users.
Create drawings that will attract the attention of the desired audience. It is ideal for real-time use, whenever and wherever you want, like previous tools. For artistic souls and talented ideas, over 1000+ innovative shapes, easy shortcuts, predefined themes and styles, 70 chart types, expandable libraries, and more are available.
Canva
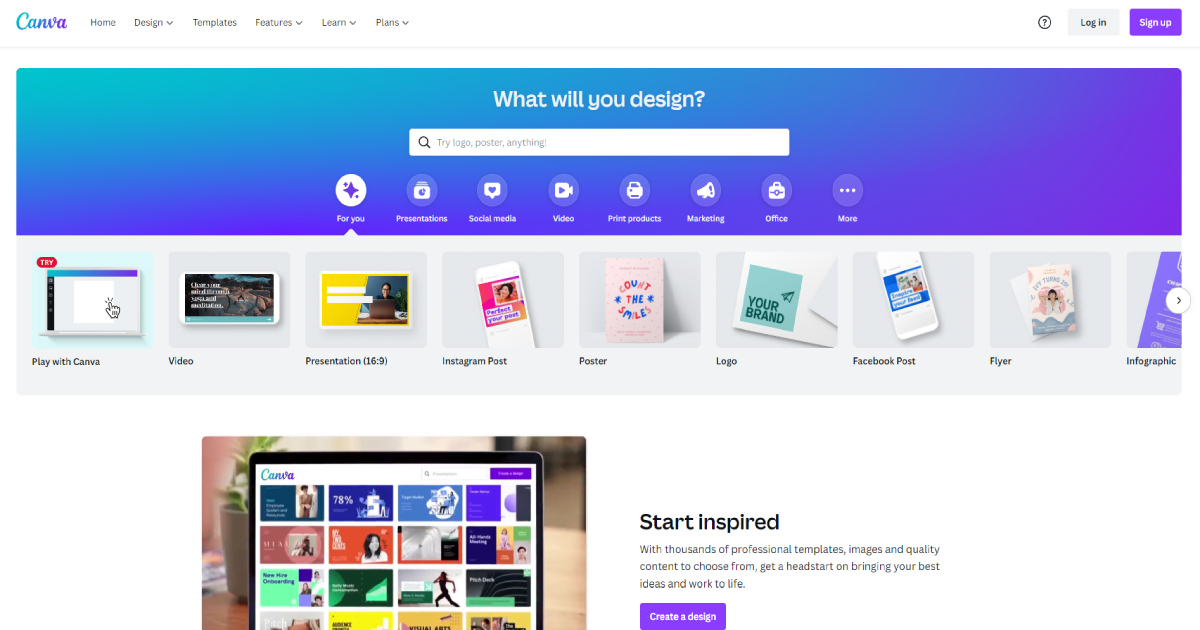
The last tool we present to you, but no less important than its predecessors, is the Canva. Without complicated software and with the ability to download, print, or share documents, create content with ease but also success. Create beautiful charts with Canva free of charge using already prepared templates.
Easy to use, it only requires you to enter data, and Canva will do the rest of the work for you.
Conclusion
Try one or all of the tools. Take advantage of them in creating engaging content. Be sure that these tools will meet your expectations and inspire you. Make your projects or reports worth reading and achieve your goals with them.